board_initial <- c("Go Big", #spot 0
                   "250", "500", "Gift card", "1000", "250", "Box", #spots 1-6
                   "750", "Go Home", "500", "1000", "Curtain 1", "500",
"750", "Go Home", "1000")Simulating a game show: Let’s make a deal
Let’s Make a Deal
R
simulations
Determining the optimal strategy for the Go Big or Go Home game using Monte Carlo simulations.
Warning
This post is in development.
The game show Let’s Make a Deal is legendary in the stats / data science world for the Monty Hall problem. In the modern version of the show, the 2 goats and a car scenario doesn’t come up the same way it used it, but there are still some interesting probability questions that do. In this post, I’m going to look at a game on the show, Go Big or Go Home.
Usually with Let’s Make a Deal games, the player has to blindly guess which curtain, box, or envelop contains the best prize. The game Go Big or Go Home, instead requires the player to roll a die to move around a game board, Monopoly style. Along the way, they land on prizes, collecting them as they try to get to spot #16 to win the grand prize. At any point, they can choose to stop, because there are 2 ‘Go Home’ spots on the board, which end the game and the player walks away with nothing. If the player misses the ‘Go Big’ spot on the first lap, they can keep going, however the game gets more difficult, as previous prizes won turn into ‘Go Home’ spots. If you have the time, watch a clip here.

Is there an optimal strategy for this game? When you should choose to stop playing? What’s the chance of winning the Go Big! prize and what’s your expected value from playing?
Building the simulator
There are over 435 millions combinations of rolling a dice between 2 and 11 times, which is a bit too much data for my Surface Pro to handle. Instead, I’m going to run simulations of 10,000 games to do this analysis. I begin with defining the board, listing the spot values in order, starting with the Go Big! spot.1
Each run of the function will run 1 independent game of Go Big or Go Home. To do this, the function:
- Rolls a die many consecutive times (50 to be safe), representing each movement along the game board.
- Determines the spot on the board after each roll, by taking the modulus of the cumulative sum of rolls.
- Maps the board positions with initial game board to relate the spot number to the value.
- Finds which spot is the game-ender, knowing that the game can end 1 of 3 ways:
- Go Home: The player lands on spot #8 or #14, which are automatic losing spots.
- Go Home: The player lands on a duplicated spot, which become ‘Go Home’ spots after the first lap.
- Go Big!: The game piece lands on the 16th spot (#0) before landing on any ‘Go Home’.
From there, we set a seed, choose a number of games/simulations (10,000), and use \{purrr\} to stack all the function runs in a single data frame.
See the code here
run_game_tidy <- function(game_id = 0, board_initial,
                          dice_sides = 6L){

  game_enders <- c("Go Big", "Go Home")

  tibble::tibble(
    game_id = game_id,
    num = 1:50,
    roll = sample(1:as.integer(dice_sides), 50, replace=TRUE),
    board_spot = cumsum(roll) %% length(board_initial)
  ) |>
    #Add in the initial board
    dplyr::left_join(tibble::tibble(board_spot = 0:15,
                                    board_start = board_initial),
                     by = "board_spot") |>
    dplyr::mutate(board_final = ifelse(duplicated(board_spot), "Go Home", board_start)) |>
    # I want the game-ending roll and all before it
    dplyr::filter(dplyr::row_number() <= which(board_final %in% game_enders)[1])

}set.seed(12334)
num_games <- 10000
sims_tidy <- 1:num_games |>
purrr::map_dfr(run_game_tidy, board_initial=board_initial)Simulation results
Over the 10,000 simulations, 1,941 games hit Go Big! (a win rate of 19.4%), with a median of 5 rolls per game.
| Go Big or Go Home simulation results by number of dice rolls | |||||
| Keep rolling | Go Home | Go Big | Lose chance | Win chance | |
|---|---|---|---|---|---|
| 1 | 10,000 | 0 | 0 | 0% | 0% |
| 2 | 8,639 | 1,361 | 0 | 14% | 0% |
| 3 | 6,914 | 1,464 | 261 | 17% | 3% |
| 4 | 5,003 | 1,197 | 714 | 17% | 10% |
| 5 | 3,310 | 1,168 | 525 | 23% | 10% |
| 6 | 1,915 | 1,174 | 221 | 35% | 7% |
| 7+ | 1,685 | 1,695 | 220 | 47% | 6% |
Before you begin the game, you know that you have about a 20% chance of winning, but those odds shift with each roll. You can’t lose on roll #1, by design, but you also can’t win. When you get to roll #2, you still can’t win, but you now have a 14% chance of losing. This chance of losing will increase as you keep playing, surpassing 50% for every roll after your 7th.
Starting at roll #3, you have a shot at winning the Go Big! prize. Just 3% on roll #3, but peaking at 10% for rolls #4 and #5. After roll #5, you can expect the game to get more challenging.
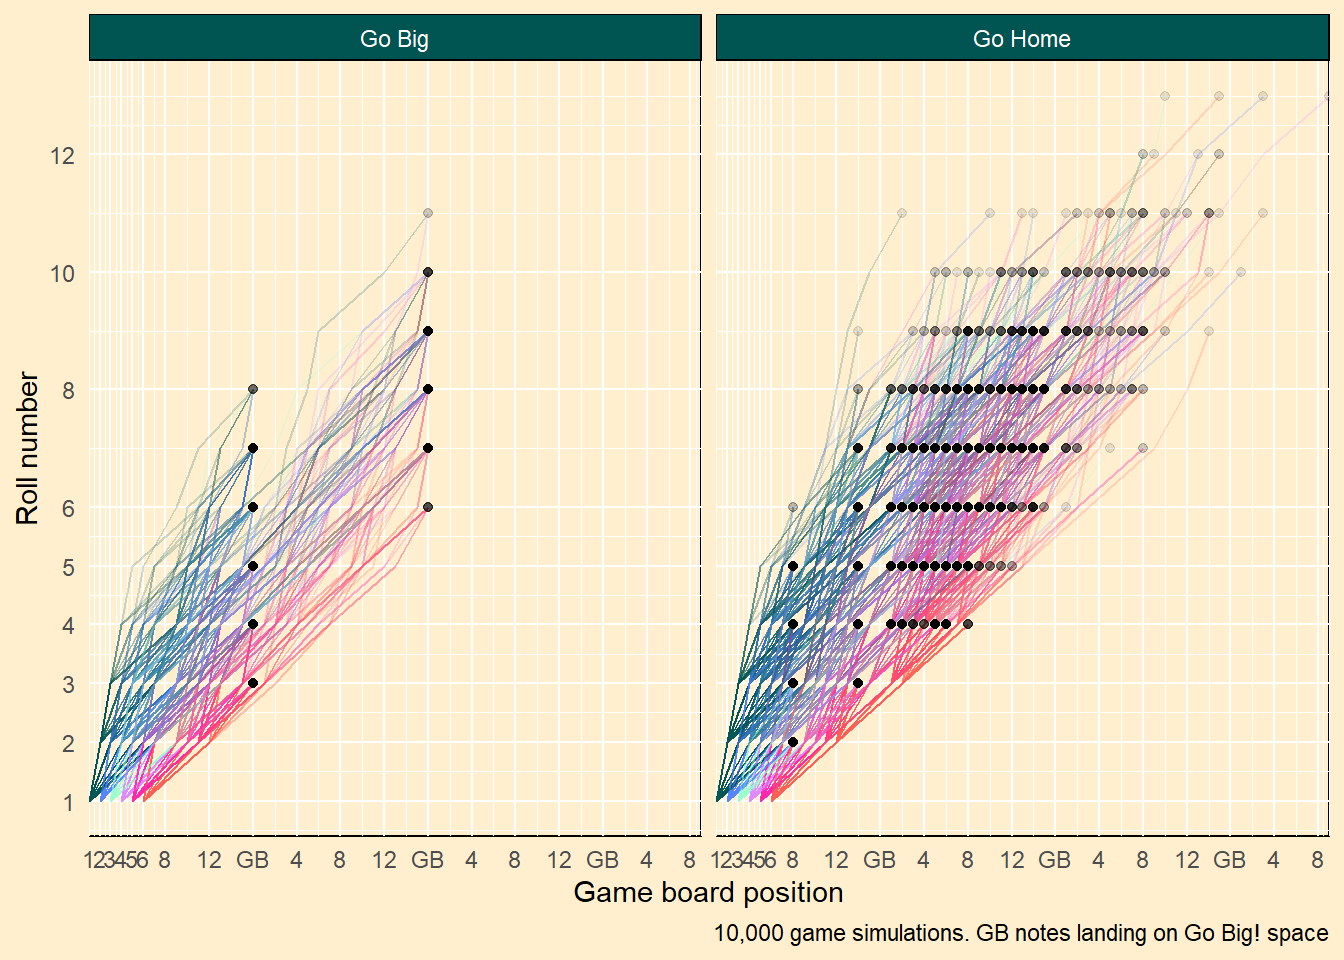
10,000 Go Big or Go Home simulations, by end result and initial roll
Winning chances by game milestone
Odds of winning on each board lap
Looking that the Go Big! half of the above plot, you’ll see that in exactly 0 of the 10,000 simulations, the game was won on the 3rd or 4th lap around the board. If you somehow manage two laps around the board without landing a win, you’re out of luck.
| Simulation results by board lap | |||
| Lap # | Go Big | Go Home | Win chance |
|---|---|---|---|
| 1 | 1,771 | 4,526 | 28% |
| 2 | 170 | 3,270 | 5% |
| 3 | 0 | 259 | 0% |
| 4 | 0 | 4 | 0% |
In fact, if you don’t win on the first lap around the board, the second lap is going to be very perilous. You have more than a 1 in 4 chance of winning the game during you first lap, but that plummets to 1 in 20 on the second.
If you make it past the first Go Home
The first Go Home on spot #8 is a nasty trap - 2,620 simulations (more than 1/4) end on that spot during the first lap. I assume this location has been optimized by the game designers, but I will verify that later.
The good news is that once you pass spot #8, your chance of winning goes up to 26%.
| Win chance after first Go Home | |||
| Pass spot #8 | Go Home | Go Big | Win chance |
|---|---|---|---|
| Nope | 2,659 | 0 | 0% |
| Pass | 5,400 | 1,941 | 26% |
Odds of winning based on first roll
The lines in the full simulation graph above are colored by the value of first dice roll of each game - the roll that you’re guaranteed to win a modest prize on. Predictably, lower first rolls look like they stay in the game longer, on average, with the lines on top (more rolls) shades of green and blue. Higher first rolls (pink and orange) are more likely to win or lose sooner.
In the 10,000 simulations, games with initial rolls of 5 or 6 had a slightly higher win rate. This seems to almost exclusively due to the fact that you are more likely to pass the first Go Home on spot 8 with higher first rolls. Once you pass spot #8, the win rate equalizes across initial roll values.
| Simulation results by first roll | ||||||
| First roll | # rolls | Prob. pass #8 |
Go Big | Go Home | Win chance | Win chance after #8 |
|---|---|---|---|---|---|---|
| 1 | 1,696 | 76% | 319 | 1,377 | 19% | 25% |
| 2 | 1,695 | 62% | 291 | 1,404 | 17% | 28% |
| 3 | 1,647 | 71% | 312 | 1,335 | 19% | 27% |
| 4 | 1,700 | 73% | 321 | 1,379 | 19% | 26% |
| 5 | 1,690 | 77% | 349 | 1,341 | 21% | 27% |
| 6 | 1,572 | 82% | 349 | 1,223 | 22% | 27% |
Expected winnings
On the game show, the player has the option at any spot to stop playing and walk away with their winnings, rather than risk landing on a Go Home spot on their next roll. A rational player would choose to stop if their current guaranteed winnings exceed their expected winnings from playing on.
To explore this, I first assign dollar values to the non-cash prizes and the Go Big! spot. The value of this Go Big! spot varies greatly by episode - sometimes it’s worth $10,000 and one time it was car valued at $56,000. To make this analysis interesting, I’ll assume a $10,000 value right now. I’ll also value the gift card at $250, the box at $750, and curtain 1 at $1,000.
Before beginning the game, we know that you have 19.4% chance of hitting Go Big! and now we know that you can also expect to walk away with about $2,400. This is greater than the value of the Go Big! prize x 0.194 because during game play, you’re collecting other prizes that you may or may not lose if you land on Go Home.
Warning: There was 1 warning in `mutate()`.
i In argument: `spot_value = ifelse(is.na(spot_value), as.numeric(board_start),
  spot_value)`.
Caused by warning in `ifelse()`:
! NAs introduced by coercion| Games with minor prizes exceeding expected winnings | |||
| End result | Prizes won before final roll | % More than | |
|---|---|---|---|
| Less than $2,400 | More than $2,400 | ||
| Go Big | 974 | 967 | 50% |
| Go Home | 4,456 | 3,603 | 45% |
Half of the Go Big! winners in the simulation actually exceeded this expected value in prizes before winning the grand prize and maybe they should have made that final roll2. This seems a bit counter-intuitive. If you have a 50% chance of winning the grand prize once you hit $2,400 in prizes, your expected value is actually bigger than $2,400. Over the course of game play, your expected value varies greatly, depending on what you have won already, the next 6 game spots in front of you, and the remaining spots after that.
Expected winnings over game play
Warning: Using `size` aesthetic for lines was deprecated in ggplot2 3.4.0.
i Please use `linewidth` instead.
Code for all the tables can be found on GitHub.
Footnotes
I start with the Go Big!, treating it as spot #0 rather than #16. This makes the modulus math easier in the function.↩︎
In games where the prize is the $56,000, the expected winnings at the start of the game climbs to $11,000 and no players ever hit this expected value before their final roll. Win going for the car, you gotta keep playing. 🚗↩︎