| dinosaur | dinosaur_detail | Scene_count | Scene_time | dinosaur_count |
|---|---|---|---|---|
| Alamosaurus | fossil | 5 | 323 | 1 |
| Brachiosaur | adult | 3 | 541 | 5 |
| Dilophosaurus | adult | 1 | 222 | 1 |
| Gallimimus | adult | 1 | 115 | 20 |
| Parasaurolophus | adult | 1 | 263 | 11 |
| Triceratops | adult | 2 | 232 | 1 |
| Tyrannosaurus | adult | 25 | 861 | 1 |
| Tyrannosaurus | fossil | 5 | 323 | 1 |
| Velociraptor | adult | 14 | 1121 | 3 |
| Velociraptor | fossil | 2 | 296 | 1 |
| Velociraptor | juvenile | 1 | 221 | 1 |
The dinosaurs of Jurassic Park and who they ate
Jurassic Park
R
gt
Working with {gt} and {gtExtras} to maximize dinosaur content.
Normally one to resist change (I build ML models daily at work but still haven’t seriously tried tidymodels), I decided to adopt both quarto (this website!) and gt in the same week. gt is the table equivalent of ggplot, with the added bonus of being able to render everything as HTML. This makes building extensions much easier and more accessible, as proven with Tom Mock’s gtExtras package.
gtExtras adds a bunch of custom style options and image utilities to the base gt package. This, in turn, makes gt a lot more fun to play with.
Jurassic Park dinosaurs
A few years ago, I documented each scene in Jurassic Park, along with the humans and dinosaurs in them, to build animated character maps with gganimate. Now I’m going to revisit this data to learn the features in gt.
My normal go-to option for rendering tables in blog posts and markdown is to use the knitr::kable() to get a table like this:
This table is fine. It’s stylized and I could further customize its appearance, but we’re confined to presented table in a rigid 2-D grid. Formatting the table can also get clunky as it lacks the ease of the grammar-of-graphics philosophy.
Instead, gt and a bit of dplyr open the door to creating table with a lot more depth:
- Transform the dinosaur names in image URLs and make the scene time series a bit more human-readable. These dinosaur image silhouettes are from PhyloPic.
- Group the dinosaurs by their life stage (juvenile, adult, very dead fossils).
- Pass the data frame to
gt()and then use gt and gtExtras functions to style the table. - Two of the most interesting functions come from gtExtras:
gtExtras::gt_merge_stackcombines the contents of 2 different columns into a single stylized one.gtExtras::gt_img_rowsconverts our column of image URLs into rendered images.
Click here to see script
gt_object <- jp_sum_dino_scenes %>%
  mutate(dinosaur_img = paste0("https://raw.githubusercontent.com/ryantimpe/JurassicPark/master/images/phylo_",
                               dinosaur, ".png")) %>%
  mutate(Scene_time = paste0(
    Scene_time %/% 60, "m ",
    str_pad(Scene_time %% 60, 2, pad = "0"), "s")
  ) %>%
  relocate(dinosaur_img, .after = dinosaur) %>%
  #Format the dinosaur lifestage detail, and group by it
  mutate(dinosaur_group = factor(toupper(dinosaur_detail),
                                 levels = c("ADULT", "JUVENILE", "FOSSIL"))) %>%
  arrange(dinosaur_group) %>%
  group_by(dinosaur_group) %>%
  #gt & styling
  gt() %>%
  tab_header(
    title = md("The Dinosaurs of *Jurassic Park (1993)*"),
    subtitle = "Screen time & Dinner time"
  )  %>%
  tab_spanner(
    label = "Dinosaur",
    columns = c(dinosaur, dinosaur_img, dinosaur_count)
  ) %>%
  cols_label(
    dinosaur = "Detail",
    dinosaur_img = "",
    dinosaur_count = "Specimens"
  ) %>%
  tab_spanner(
    label = "Movie details",
    columns = c(Scene_time, Scene_count)
  ) %>%
  cols_label(
    Scene_time = "Scene time",
    Scene_count = "# of scenes"
  ) %>%
  cols_align(
    align = "right",
    columns = Scene_time
  ) %>%
  tab_footnote(
    footnote = "Total length of scenes featuring dinosaur, though not necessarily total screen time.",
    location = cells_column_labels(columns = "Scene_time")
  ) %>%
  tab_options(
    footnotes.font.size = "80%"
  ) %>%
  #gtExtras functions to do some really fancy things with the cells
  gtExtras::gt_img_rows(columns = c(dinosaur_img), height = 25) %>%
gtExtras::gt_merge_stack(dinosaur, dinosaur_detail)| The Dinosaurs of Jurassic Park (1993) | ||||
|---|---|---|---|---|
| Screen time & Dinner time | ||||
| Dinosaur | Movie details | |||
| Detail | Specimens | Scene time1 | # of scenes | |
| ADULT | ||||
Brachiosaur
adult |
 |
5 | 9m 01s | 3 |
Dilophosaurus
adult |
 |
1 | 3m 42s | 1 |
Gallimimus
adult |
 |
20 | 1m 55s | 1 |
Parasaurolophus
adult |
 |
11 | 4m 23s | 1 |
Triceratops
adult |
 |
1 | 3m 52s | 2 |
Tyrannosaurus
adult |
 |
1 | 14m 21s | 25 |
Velociraptor
adult |
 |
3 | 18m 41s | 14 |
| JUVENILE | ||||
Velociraptor
juvenile |
|
1 | 3m 41s | 1 |
| FOSSIL | ||||
Alamosaurus
fossil |
 |
1 | 5m 23s | 5 |
Tyrannosaurus
fossil |
|
1 | 5m 23s | 5 |
Velociraptor
fossil |
|
1 | 4m 56s | 2 |
| 1 Total length of scenes featuring dinosaur, though not necessarily total screen time. | ||||
Multiple images in a single cell
Next, I wanted to add another column showing which humans, animals, and other dinosaurs were killed by each dinosaur. More than just a count, I wanted to include this as a visual image representaton. While the dilophosaurus only killed one person in the movie, the velociraptors and tyrannosaur had multiple victims. As written, the gtExtras::gt_img_rows function did not support multiple URLs in a cell.
Not a problem, though! Checking the source code for gtExtras::gt_img_rows and reviewing how he also was able to render multiple icons in another function, gt_fa_repeats, I was able to write a new function to allow for multiple images in a cell.
Rather than rework that here, I submitted a pull request to gtExtras and now the function gt_img_multi_rows() is in the development version of the package.
Click here to see script
gt_object2 <- jp_sum_dino_scenes %>%
  mutate(dinosaur_img = paste0("https://raw.githubusercontent.com/ryantimpe/JurassicPark/master/images/phylo_", dinosaur, ".png")) %>%
  mutate(Scene_time = paste0(
    Scene_time %/% 60, "m ",
    str_pad(Scene_time %% 60, 2, pad = "0"), "s")
  ) %>%
  filter(dinosaur_detail == "adult") %>%
  # Add in our list of what each dinosaur ate.
  # This is a nested data frame from tidyr::nest() with a list() of each victim name
  left_join(eat_sum) %>%
  relocate(dinosaur_img, .after = dinosaur) %>%
  select(-Scene_count, -dinosaur_detail) %>%
  gt() %>%
  tab_header(
    title = md("The Dinosaurs of *Jurassic Park (1993)*"),
    subtitle = "Screen time & Dinner time"
  ) %>%
  tab_spanner(
    label = "Dinosaur",
    columns = c(dinosaur, dinosaur_img, dinosaur_count)
  ) %>%
  cols_label(
    dinosaur = "Detail",
    dinosaur_img = "",
    dinosaur_count = "Specimens"
  ) %>%
  #JP movie details
  tab_spanner(
    label = "Movie details",
    columns = c(Scene_time, eaten_img)
  ) %>%
  cols_label(
    Scene_time = "Scene time",
    eaten_img = "Kill count"
  ) %>%
  cols_align(
    align = "right",
    columns = Scene_time
  ) %>%
  cols_align(
    align = "left",
    columns = eaten_img
  ) %>%
  tab_footnote(
    footnote = "Adult living specimens only.",
    location = cells_column_labels(columns = "dinosaur_count")
  ) %>%
  tab_footnote(
    footnote = "Total length of scenes featuring dinosaur, though not necessarily total screen time.",
    location = cells_column_labels(columns = "Scene_time")
  ) %>%
  tab_options(
    footnotes.font.size = "80%",
    table.background.color = "#ffefcf"
  )
Joining, by = c("dinosaur", "dinosaur_detail") gt_object2 <- gt_object2 %>%
#gtExtras functions
gtExtras::gt_img_rows(columns = dinosaur_img, height = 25) %>%
#The new function ;)
gtExtras::gt_img_multi_rows(columns = eaten_img, height = 25) | The Dinosaurs of Jurassic Park (1993) | ||||
|---|---|---|---|---|
| Screen time & Dinner time | ||||
| Dinosaur | Movie details | |||
| Detail | Specimens1 | Scene time2 | Kill count | |
| Brachiosaur | |
5 | 9m 01s | |
| Dilophosaurus | |
1 | 3m 42s |  |
| Gallimimus | |
20 | 1m 55s | |
| Parasaurolophus | |
11 | 4m 23s | |
| Triceratops | |
1 | 3m 52s | |
| Tyrannosaurus | |
1 | 14m 21s | 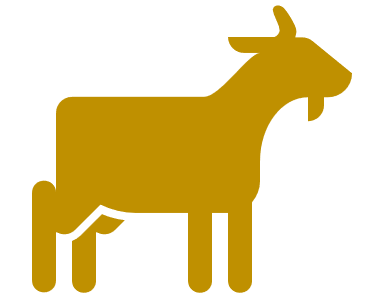  |
| Velociraptor | |
3 | 18m 41s |     |
| 1 Adult living specimens only. | ||||
| 2 Total length of scenes featuring dinosaur, though not necessarily total screen time. | ||||
NFL example
Here’s a much smaller example that should be easy to reproduce without the Jurassic Park data.
library(gt)
library(gtExtras) #dev version 0.4.1.9004

teams <- "https://github.com/nflverse/nflfastR-data/raw/master/teams_colors_logos.rds"
team_df <- readRDS(url(teams))

conf_table <- team_df %>%
  dplyr::select(team_conf, team_division, logo = team_logo_espn) %>%
  dplyr::distinct() %>%
  tidyr::nest(data = logo) %>%
  dplyr::rename(team_logos = data) %>%
  dplyr::arrange(team_conf, team_division) %>%
  gt() %>%
  gt_img_multi_rows(columns = team_logos, height = 25)

conf_table| team_conf | team_division | team_logos |
|---|---|---|
| AFC | AFC East |     |
| AFC | AFC North |     |
| AFC | AFC South |     |
| AFC | AFC West |     |
| NFC | NFC East |     |
| NFC | NFC North |     |
| NFC | NFC South |     |
| NFC | NFC West |     |