Carryover impact & the marketing funnel
MMM
Feature engineering for MMM with the carryover impact and an introduction to the marketing funnel.

Marketing modeling tries to distill the complex thought process of many human consumers into a handful of econometric equations. The results will never capture this perfectly but hopefully can be helpful. Assumptions around marketing data and business logic help make building more accurate models possible. Before running an econometric regression, transformations of the marketing data with feature engineering can help to more accurately represent the shopper relationship with media.1
After selecting data, three core assumptions around the marketing data help structure the model.
- Marketing should have a positive impact on sales.
- The impact of marketing in one time period carries over into future periods.
- It’s possible to do too much marketing.
The first one is simple - the coefficients coming out of a regression should be non-zero for marketing inputs.2
The other two assumptions need more explanation. Here I’ll start with #2.
Carryover effect
You see a commercial for a cheesecake. It looks delicious, but it’s 8pm on a Tuesday and you’re on your couch in your pajamas. No way you’re going out. You continue on with your life and don’t see the commercial again.
A week later, you’re grocery shopping and see the cheesecake. You remember how great it looked on the TV and you buy it.
The marketing you saw last week directly influenced your purchase decision this week (and perhaps next week too!). In marketing mix models, we use the carryover impact to capture this assumption around our marketing.
In the modeling process, the raw marketing data is transformed to allow its impact to flow from one week into another. The most common way to capture the carryover impact is to allow its full impact at the time it was released and then over time the impact of the marketing fades.
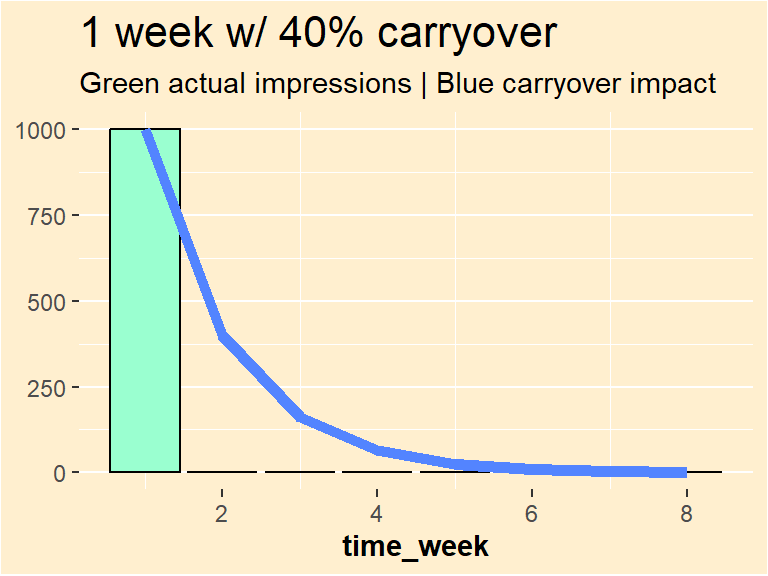
Using our example above, the TV commercial reached 1,000 people when it aired. Some of those people were influenced to buy cheesecakes that week. The next week, some shoppers will still be influenced by it, but not all 1000 people… maybe just 400. The following week, only 160 of those viewers might still be impacted. Eventually, barely anyone is influenced by the TV commercial to buy a cheesecake.3 In this scenario, the TV commercial had a 40% carryover rate each week.
The carryover impact is a simplified mathematical representation of how sticky marketing is in shoppers’ minds.
The marketing funnel
A challenge is estimating exactly what that carryover rate should be for a type of marketing4. Different types of media have different purposes and therefore different carryover impacts. Marketers use this funnel diagram to help classify some general tactics, following a shopper’s relationship with the business.
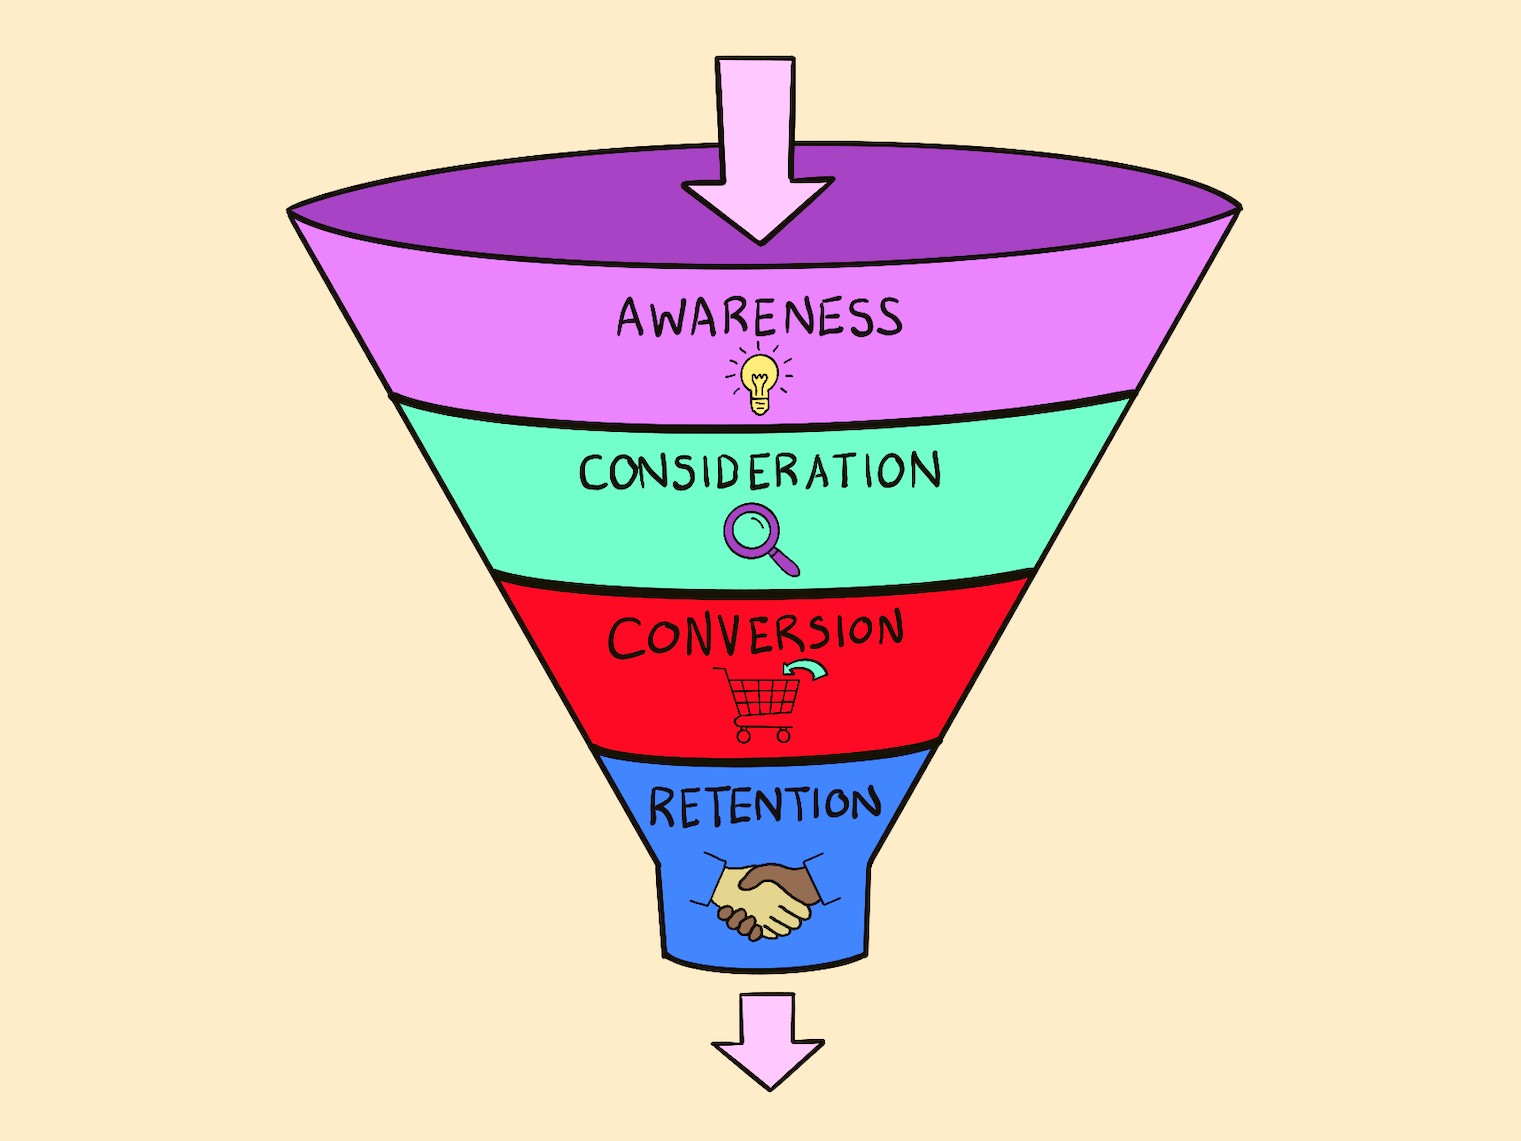
- Awareness: At the top there are marketing tactics to inform people about the products. Marketing that is informational and has a wide reach to relate to as many potential shoppers as possible. Example: TV commercials during big sporting events.
- Consideration: Marketing targeted at people who actually may be interested in your product soon. Media can be used to nudge them toward your product. Example: Toy flyers before Christmas.
- Conversion: Marketing with the goal of getting shoppers to buy now. The potential customers are actively shopping and the marketing’s goal is for them to put your product in their cart. Example: Online store banner ad, a display case in a grocery store aisle.
- Retention: Marketing targeted at returning shoppers. These shoppers have used your product before and it should be a small nudge to get them to buy again. Example: Email to previous shoppers.
As a general rule, the carryover rate used for marketing tactics at the top of the funnel is longer than those at the bottom of the funnel. TV commercials are memorable and funny, while banner ads and paid search just want your clicks. TV commercials could have that 40% carryover impact while an online banner ad might have close to 0%.
Visualizing the impact
With one week of marketing spend the visualization of this impact is simple. A caveat is that the units of measurement lose meaning - 1000 impressions during Week 1 becomes 400 “impressions” in Week 2. The meaning of an impression is less literal now, even though they are considered the same in the modeling process.
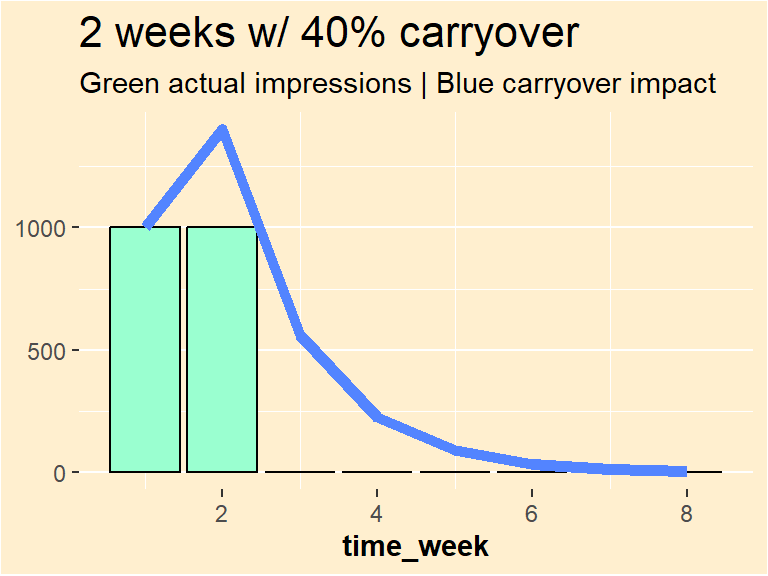
When marketing occurs over multiple weeks, this carryover impact is additive. So with 1000 impressions over 2 weeks, the transformed series with 40% carryover would be:
| Week | Calculation | Total |
|---|---|---|
| Week 1 | 1000 | 1000 |
| Week 2 | 1000 + (40% * 1000) | 1400 |
| Week 3 | (40% * 1000) + (40% * 40% * 1000) | 560 |
| Week 4 | (16% * 1000) + (6.4% * 1000) | 224 |
| Week 5 | (6.4% * 1000) + (2.56% * 1000) | 89.6 |
Up next
Much more on carryover impacts in future posts, including how to include this as part of the model training and optimization process. But first, diminishing returns!
Follow me on BlueSky at @ryantimpe!
Footnotes
For now, since I’m building example MMMs with linear regressions, the transformations in this post will happen independent of the model fitting. Later on I’ll revisit this.↩︎
If a business’s marketing is deterring potential customers, there are bigger problems than needing an MMM.↩︎
This considered only the short-term impact from marketing. There’s a long-term component we can consider later.↩︎
Options for determining the best carryover rates for marketing can be figured out using hyperparameter tuning or direct model fitting, with the help of domain knowledge constraints.↩︎