Data of the Age of Reptiles: Part 1 - The Timeline
Originally published on December 20, 2017. Moved to new website on August 6, 2023 without edits.
Introduction
The Great Hall of the Yale Peabody Museum is home to one of the world’s largest scientifically accurate (at the time) natural history murals. The Age of Reptiles mural, painted by Rudolph Zallinger from 1942-47, spans a 110ft wall in the hall and depicts the museum’s specimens as they might have looked when alive.
Even after 4 years of volunteering, I still discover new details in the painting each time I visit. I have read the book about the mural (and the book about the Peabody), but I still have questions about the art and science behinds Zallinger’s work.
I’m not a paleobiologist or an artist, but I hope to use my skills as a data scientist to answer some of the questions I have asked myself over the past few years.
The Data
A jpeg image of the Age of Reptiles mural (or any image) is a dataset with five dimensions: x- & y-cooridates and red, green, and blue light channels. Using R, I converted the jpeg with resolution (1250*167) to a dataframe of 626k total values to proceed with the analysis.
A Timeline?
The mural is a timeline, spanning five geological periods between 65 milllion and 362 million years ago. Zallinger splits the mural into these periods using large trees spanning the height of the mural.
Many of my questions about the mural include breakdowns by these five periods, so my first processing task was to convert the 1250 horizontal pixels into years, and then grouping them by the start/end dates of the geological periods.
On average, if the Age of Reptiles mural were a true timeline, it would cover an impressive 238 thousand years in each pixel. In the 110ft long actual painting, each inch of paint would cover 225 thousand years.
Cutting those pixels into the geological periods and overlaying them on the painting results in the image below:
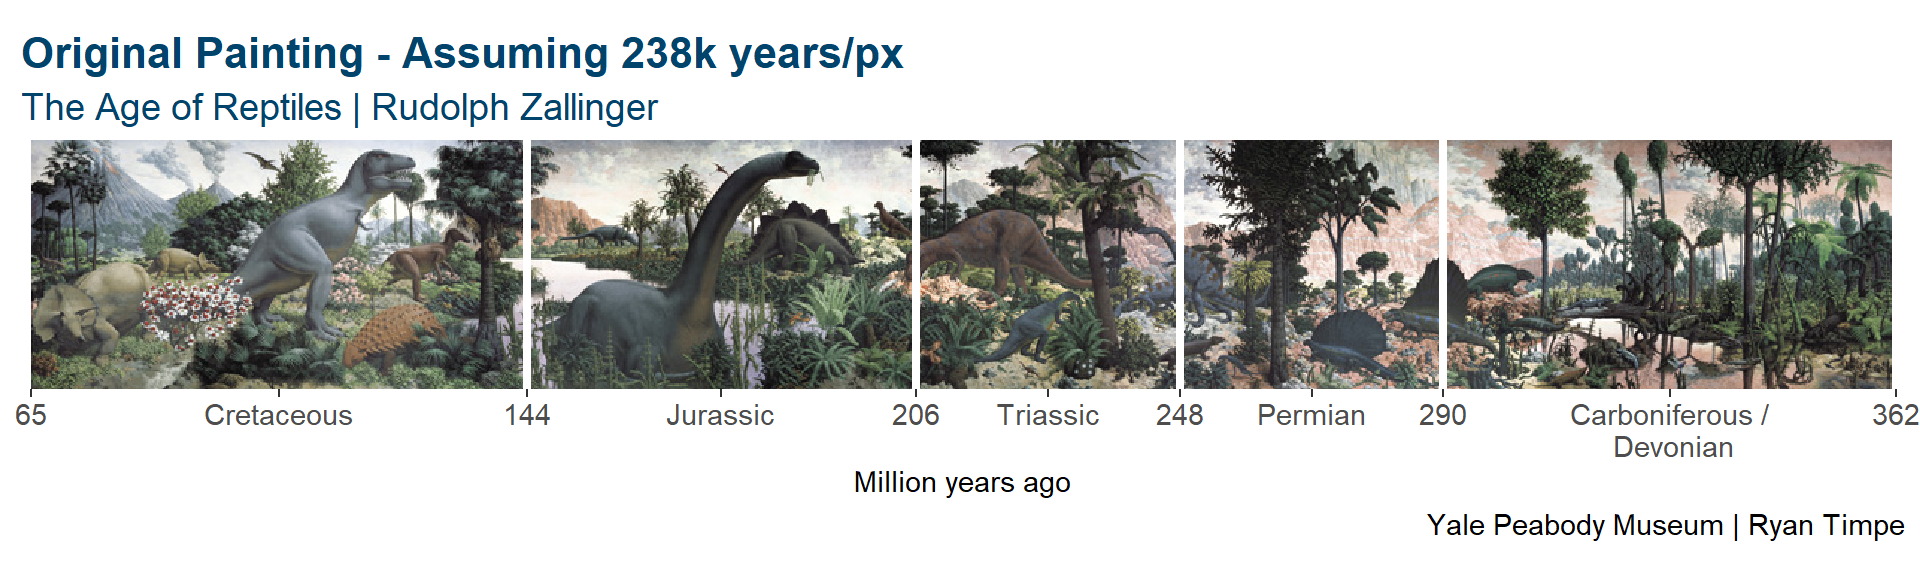
These calculated period boundaries (the white lines) do not overlap with the painted boundaries (large trees). The calculated Cretaceous/Jurassic boundary is slightly to the right of the tree divider. The calculated Jurassic/Triassic boundary splices the head of an Allosaurus, while the boundary tree is far closer to the Permian period.
Correcting the timeline
| Period | Period Start | Period End | K yrs / px | Px / Mil yrs |
|---|---|---|---|---|
| Cretaceous | 144 | 65 | 257.1 | 3.9 |
| Jurassic | 206 | 144 | 150.3 | 6.7 |
| Triassic | 248 | 206 | 356.4 | 2.8 |
| Permian | 290 | 248 | 163.6 | 6.1 |
| Carboniferous / Devonian | 362 | 290 | 462.4 | 2.2 |
As painted, the Jurassic and Permian periods are over-represented by almost 100% length, while the Triassic and Carboniferous / Devonian periods about half as long as they should be.
What if the mural were a more accurate timeline and Zallinger painted each inch of the painting to cover 225 thousand years in every period? The painting would look more like…

I rescaled the x-coordinates by an adjustment factor for each period, then rounded each to the closest integer (I can’t plot fractional pixels). For the periods that were too large, I ended up with multiple colors per pixel, which were average together. For the proportionally shorter periods in the orignal painting, this resulted in some blank pixels which were filled in using the value to their left.
The bottom image in the chart distorts the original painting so that every pixel represents the same number of years. Due to the scale of the image, it is difficult to see all the detail. Below, I just render the Cretaceous and Jurassic periods for comparison.
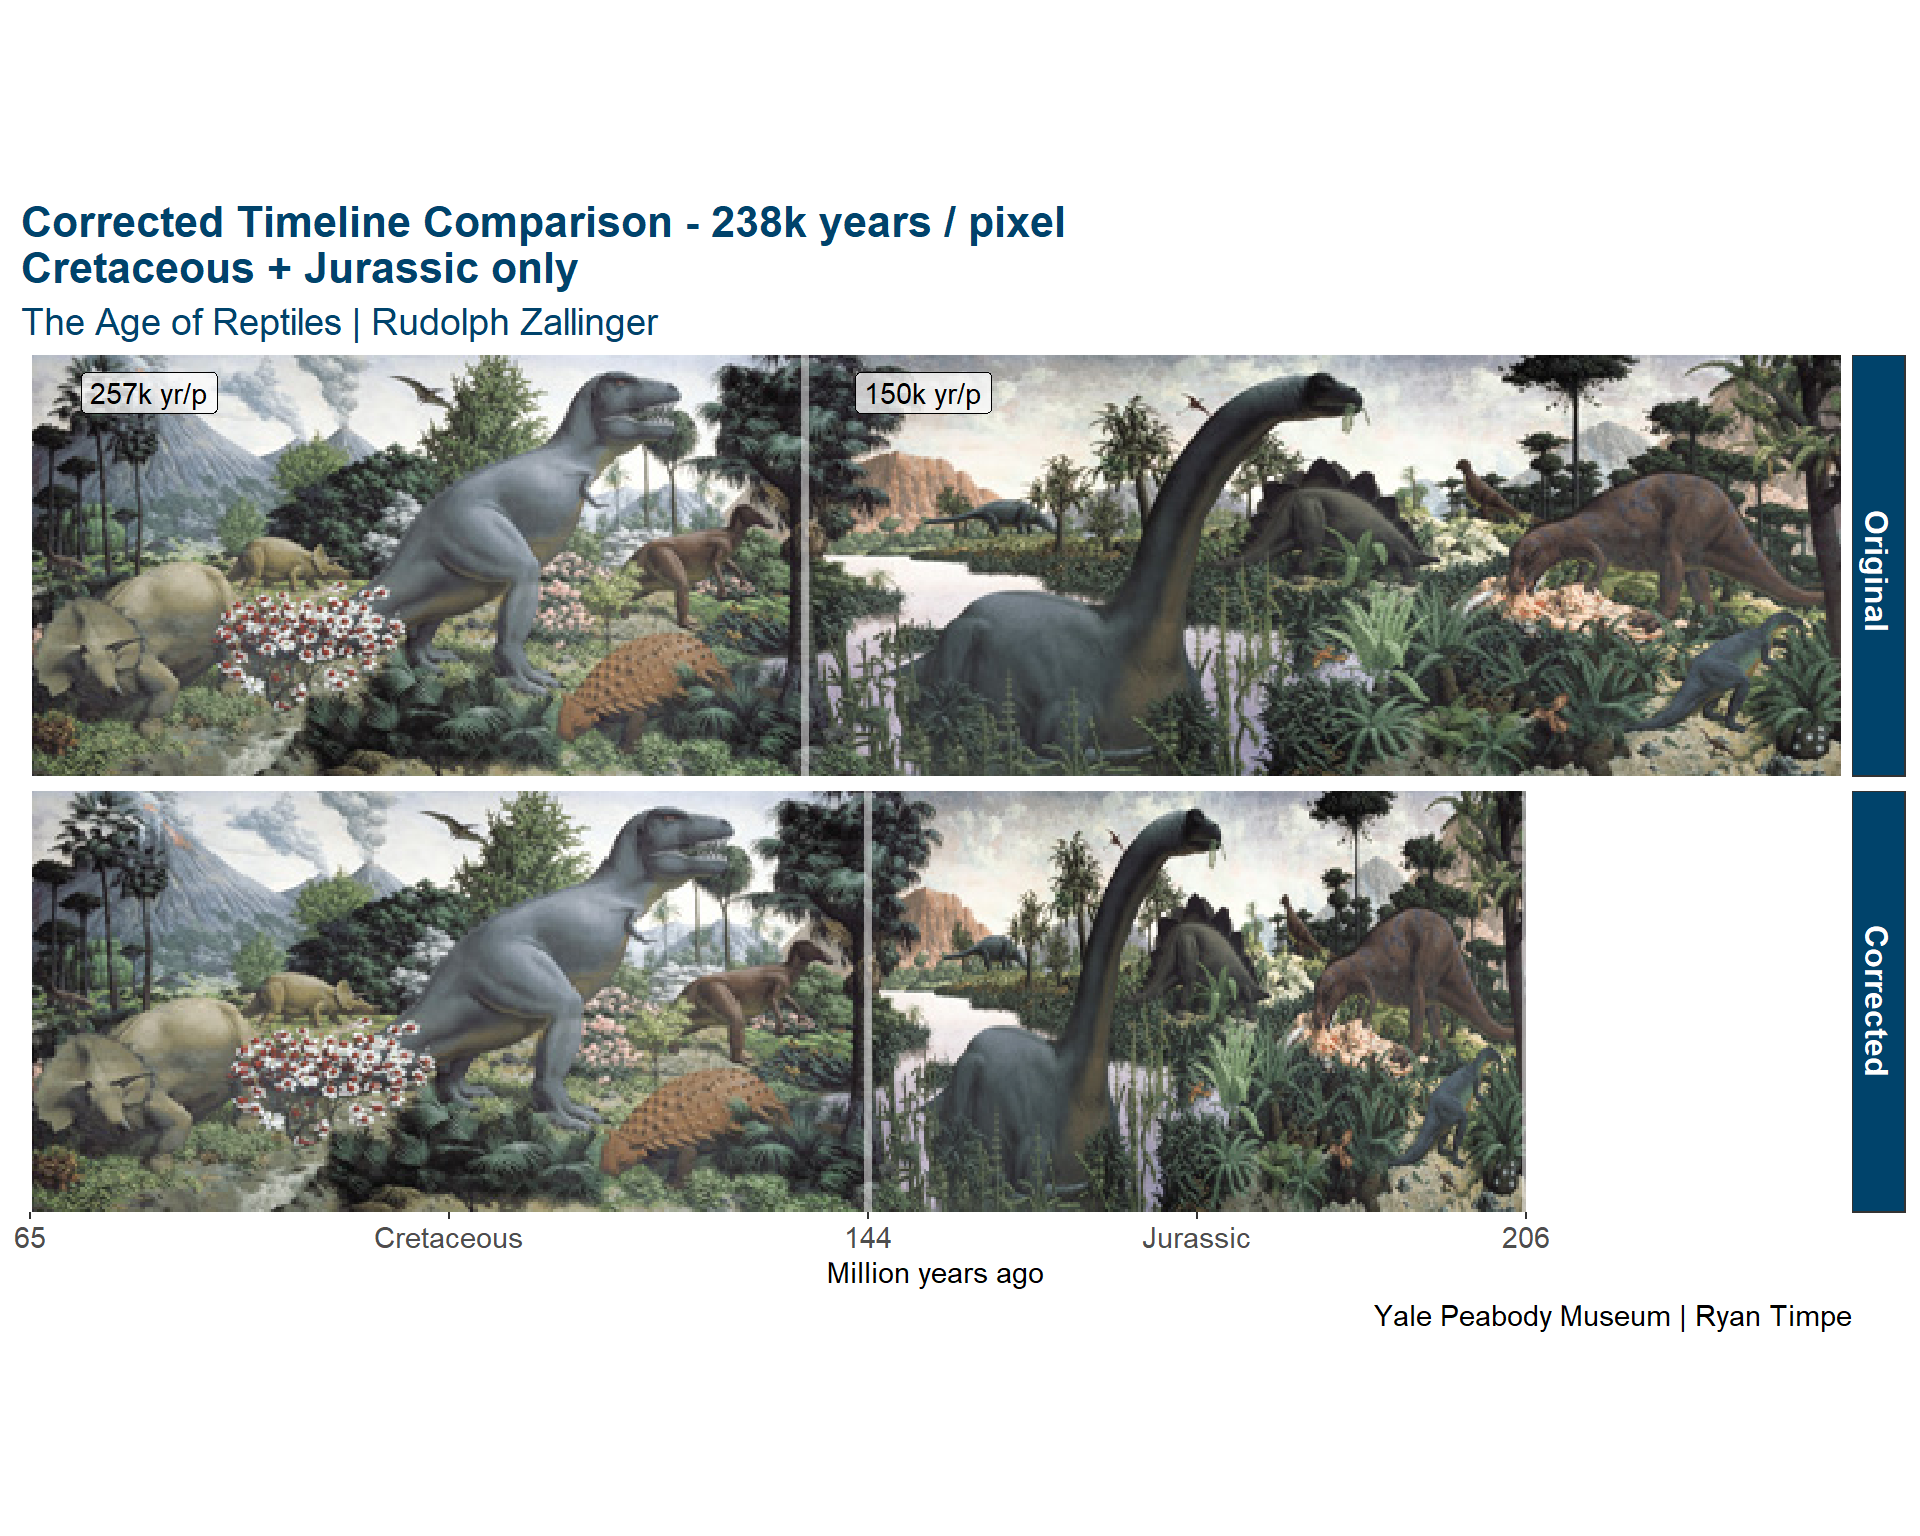
Zallinger likely painted the periods with different time scales to accomodate all of the animals he wanted to include. In the painting, Brontosaurus, the Peabody’s most famous dinosaur is prominently featured, along with other famous Jurassic dinosaurs including Allosaurus, Stegosaurus, and Archaeopteryx. This likely would not have been possible with accurately-proportioned period lengths.