| Word | Num Posts | Word | Num Posts | |
|---|---|---|---|---|
| dinosaur | 508 | triceratops | 43 | |
| mineral | 193 | bear | 41 | |
| rock | 138 | turtle | 33 | |
| bird | 103 | brontosaurus | 29 | |
| quartz | 52 | mummy | 28 | |
| torosaurus | 45 | tyrannosaurus | 18 | |
| squid | 44 | stegosaurus | 6 |
Using machine learning to estimate where museum Instagram posts were taken
Yale Peabody
R
Follow-up to analysis of Instagram posts tagged at the Peabody Museum. Combining image and text analysis to locate images within the museum.
Note
Originally published on November 21, 2018. Slightly revisited and revised on August 7, 2022.
Introduction
A few months ago, I wrote a post using Google Cloud Vision AI to examine Instagram photos taken at the Yale Peabody Museum. Using cluster analysis and principal component analysis, this work provided the museum staff with a few ways to think about how museum guests interact with the exhibits through social media. One problem, however, is that the analysis didn’t reach any conclusions, nor did it clearly answer a key question: which exhibits on social media are most popular with museum guests?
More than ever, this question is crucial for the museum to understand. Edward P Bass just pledged a $160 million dollar donation toward the renovation of the museum. With this, the museum will be doubling its floor space and rebuilding every exhibit.
Goal
Which exhibits in the Yale Peabody Museum do guests most engage with on Instagram?
This post is less technical than the previous post, focusing more on insights from the analysis.
Slides
A few weeks ago I presented these results to a small group of volunteers and staff members at the museum. This post will be a selection of some of the highlights.
Which exhibits are guest talking about?
One way to understand which exhibits guests are posting on Instagram is to examine the text in their captions. This quick analysis suggests that the dinosaur and mineral halls are the most popular exhibits.
The counts of each of these key words are relatively low for our sample size of 3,500 posts.
Image contents with Google Cloud Vision
As discussed in the previous post, Google Cloud Vision uses artificial intelligence to guess the contents of each image. This allows us to study each post, even if the guest did not provide a helpful caption.
For each of the 3,500 images, I collected up to the top six labels (some images have fewer). Below are the top 200 labels.
Again, here we see ‘dinosaur’ and ‘mineral’ as some of the top labels. There are also labels for specific dinosaurs, ‘sculpture’ in reference to the Torosaurus statue outside the museum, and then labels associated with portraits of people and selfies.
Cluster Analysis
I then perform cluster analysis on these Instagram posts, grouping images with similar Cloud Vision labels into eleven unique clusters. This analysis is slightly different than the version I completed in July, due to the increase in special events at the museum. I now find that 11 is the optimal number of clusters and there’s no longer the large “Exhibits & other” cluster.
| Cluster | % | Cluster | % | |
|---|---|---|---|---|
| Fossil Halls | 47% | B&W Photography | 3% | |
| Mineral Hall | 11% | Selfies | 3% | |
| Families | 10% | Outdoor Architecture | 3% | |
| Birds / Diorama | 9% | Indoor Architecture | 2% | |
| Art & Scultpure | 7% | Food | 1% | |
| Torosaurus | 5% |
Principal Component Analsyis
PCA is a way to understand the biggest differences between Instagram posts using the Cloud Vision labels. For each principal component, each label gets a positive, negative, or near-zero score. I then curate these positive and negative scores in the context of the museum to understand the variance between posts.
Below is a sample of 10 of the more sensible components.
| Like this... | ... or this? |
|---|---|
| Selfies & people | Objects |
| Man-made | Natural |
| Insects & flowers | Dinosaurs |
| Minerals | Dioramas |
| Non-living | Living |
| Carvings | Natural |
| Outside | Inside |
| Birds | Mammals |
| Events | Non-events |
| Modern architecture | Gothic architecture |
Mapping the Instagram posts
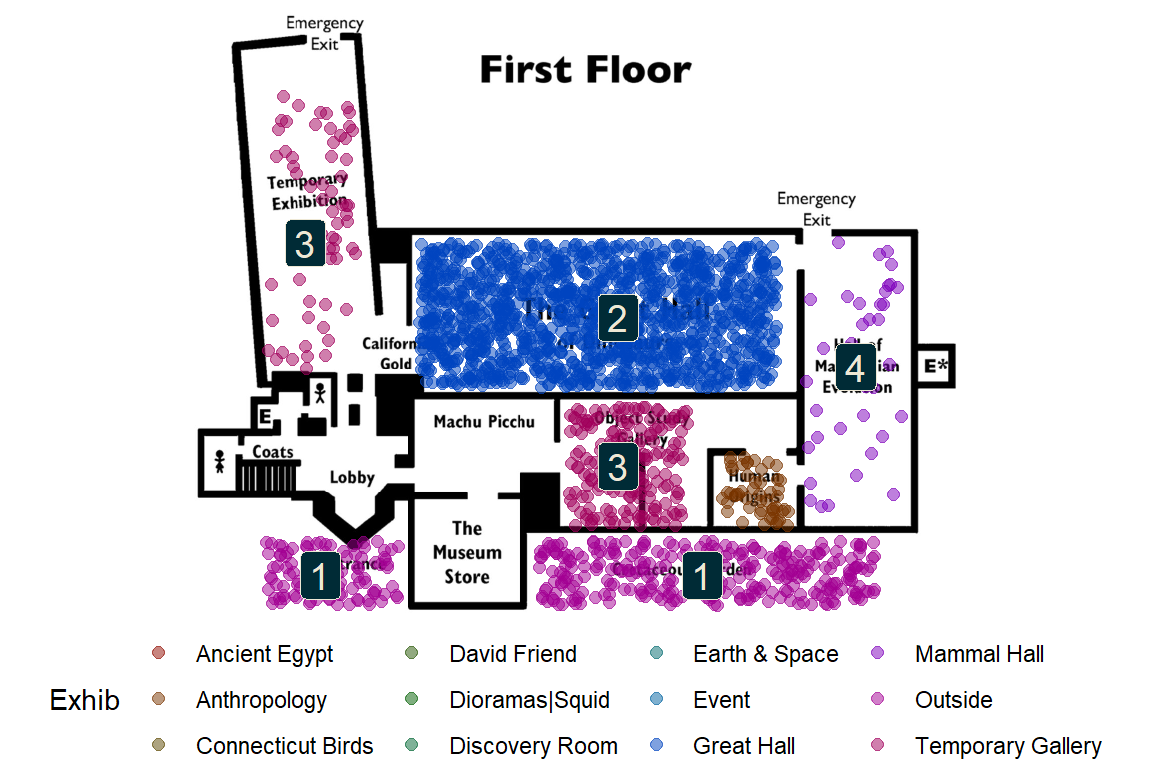
I combine all the analyses for each Instagram post - caption text analysis, cluster analysis, and principal components - to estimate the location of the post within the museum. Each post is allocated to one of 15 rooms/exhibits in the museum or an ‘Events’ category. The percentages below are estimates and likely have significant error bars in either direction.
First Floor insights
- The guest experience begins before they enter the museum
- People like dinosaurs… of course
- Changing & new exhibits drive engagement
- No love for the Mastodon!
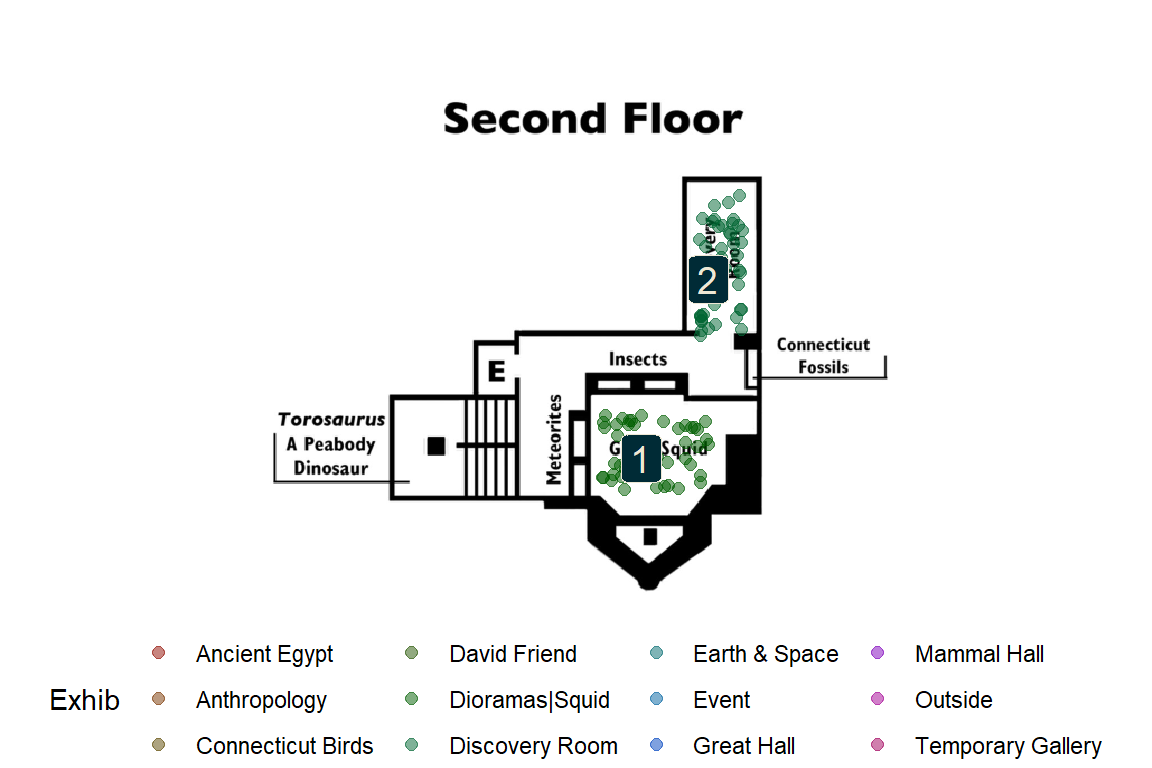
Second Floor insights
- The lobby (squid & arches) is part of the museum experience
- Guests put down their phones in the Discovery room… but they love the ants and walking sticks
Third Floor insights
- The minerals in the David Friend Hall make great photos
- Guests like the dioramas, the bears, & the dodo
- Events (MLK, Fiesta, Bones & Beer, birthdays) drive posts
- Space and Connecticut geology galleries lack engagement

Popular Exhibits
Share of photos taken in each exhibit hall.
| Exhibit | % Posts | Exhibit | % Posts | |
|---|---|---|---|---|
| Great Hall | 38% | Ancient Egypt | 2% | |
| David Friend | 17% | Anthropology | < 2% | |
| Cretaceous Garden | 9% | Discovery Room | < 2% | |
| Temporary Gallery | 8% | Squid | < 2% | |
| Dioramas | 7% | Mammal Hall | < 2% | |
| Connecticut Birds | 6% | NE Dioramas | < 2% | |
| Entrance | 3% | Earth & Space | < 2% | |
| Event | 3% | Native American | < 2% |
Why is this important?
Every Instagram post by a guest is a mini advertisement for the museum.
Social media posts about great experiences at the Peabody will inspire more people to visit.
A dynamic museum experience will encourage guests to return.
The museum has limited space. If guests aren’t engaging with a hall, perhaps we can do better.
Comments on social media posts can provide insights on guest sentiment.