Marketing Mix Modeling - an intro
MMM
First in a series of mini posts about MMM. Here, I introduce the concept and value of marketing models before diving into more detail in upcoming weeks.

Meet Dorothy, Rose, Blanche, and Sophia. They run a small but growing cheesecake business in Miami.
For the past three years, they have been sporadically marketing their business using local tv commercials, digital media, and other channels. These investments are a significant part of their modest budget.
Today at the breakfast table, in between the zingers and laugh tracks, Dorothy asks a seemingly innocuous question: Is our marketing worth it?
The question is clear but answering it is a challenge, so the Girls turn to us & data science to help. Before we can get to a yes/no answer, we must first figure out their return on investment (ROI). In order to do that, we need to compare the gains from marketing with the costs of running the marketing.1
In marketing data science there are many tools and models that can be used to help the Girls answer this question about their marketing performance. Each tool has unique benefits depending on the type of marketing being done, the way shoppers consume the product, the availability of data, and the questions themselves. One of the most powerful and broad modeling tools is Marketing (or Media) Mix Modeling or MMM.
Marketing Mix Modeling uses statistical regression to decompose total sales into its individual drivers, isolating the incremental lift from marketing tactics versus external factors. This allows marketers to attribute returns of specific media channels and simulate future spend scenarios to optimize their budget.2
Cheesecake sales.
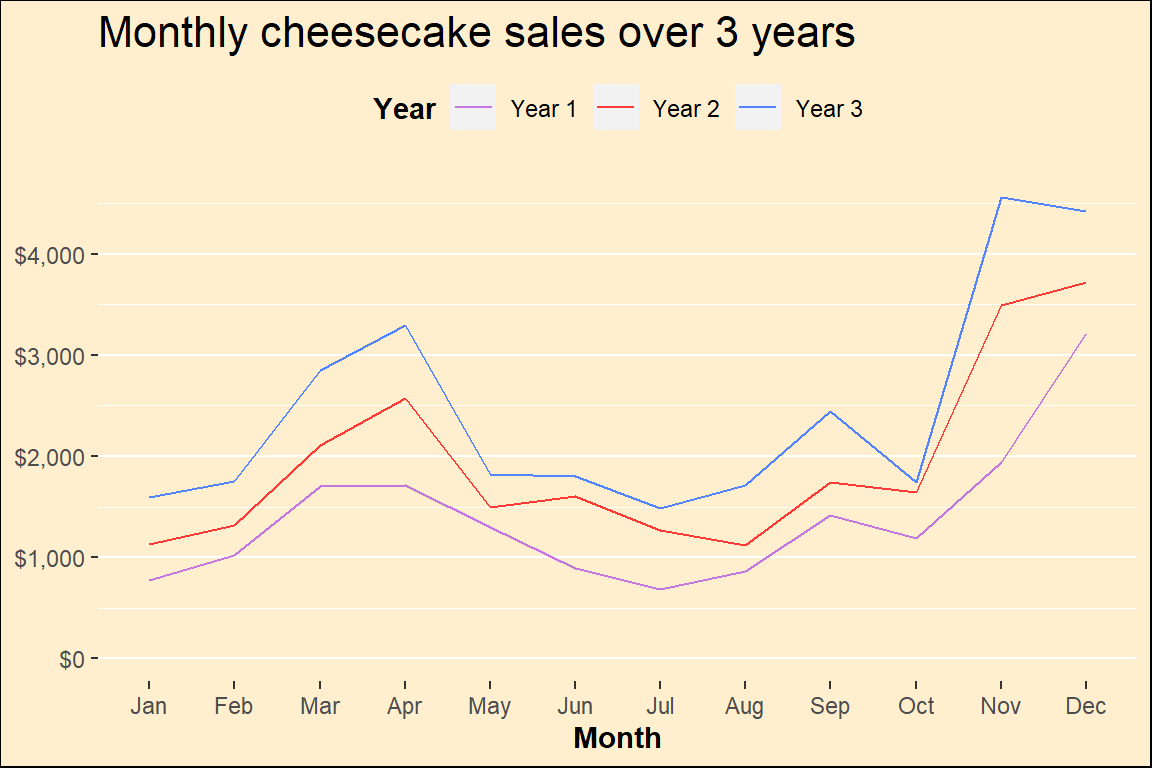
Without getting into MMM just yet, let’s take a look at the Girls’ monthly cheesecake sales over the last 3 years. For visual clarity, I’ve stacked the 3 years with separate lines.
There are patterns! There are sales every month - people consistently demand some cheesecake each month (about $500 worth). In MMM, this is the baseline, which at a minimum includes a linear regression intercept. (The b in \(y = mx + b\)). There also is an upward trend over the years - the default sales in Year 3 are higher than Year 1. For now, we can call this baseline as well. (Later on, we will need to figure out if this is organic growth or driven by other factors).
There are other peaks and troughs. Some of these repeat each year - it looks like cheesecake sales grow during the holidays (Easter, Thanksgiving, Christmas) and decline during the summer (beach season).
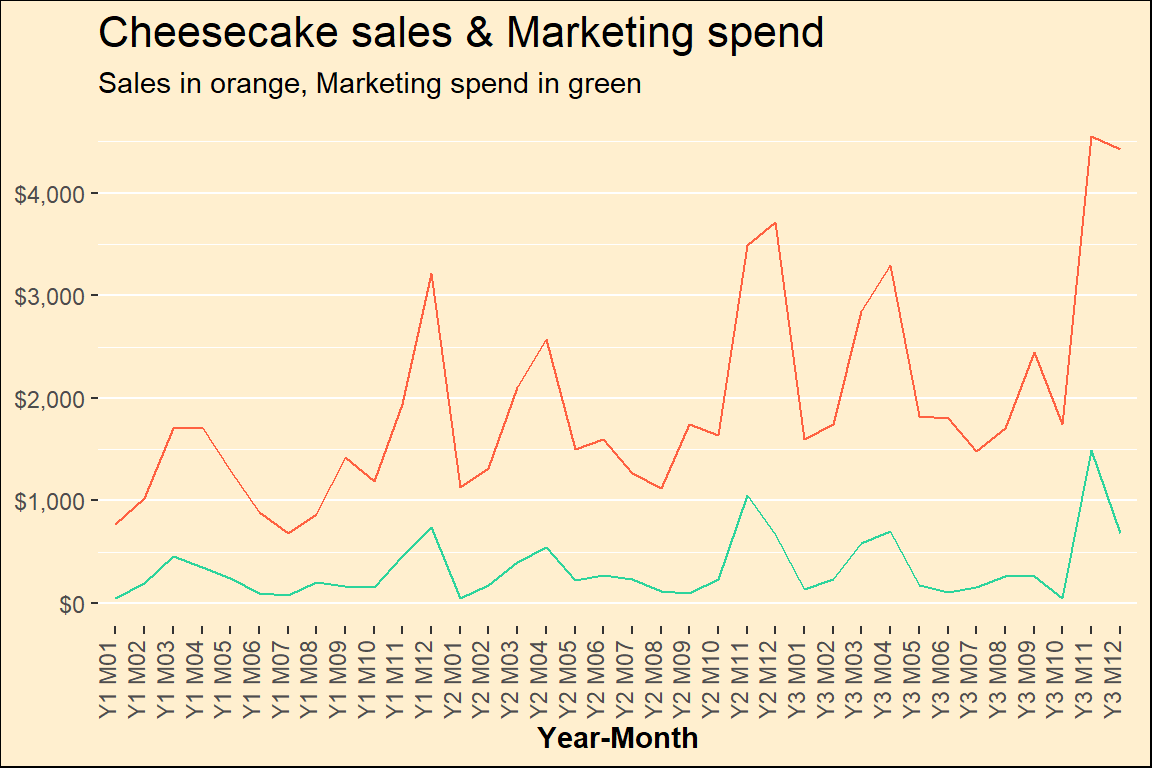
Other peaks have different patterns and no immediate explanation. But if we compare them with a chart of the Girls’ marketing investments over time, we see some similarities. From this data alone, it looks like yeah, marketing is working. It’s not consistent, but there’s definitely a relationship between marketing and sales.
With this, we’ve explained the sales from our data without using any math. Now MMM can put numbers on this intuition and help us determine if the marketing investments are worth it.
A very simple MMM
The data above is limited but enough to build a basic MMM to help the Girls measure the value of their marketing investments. I’ll fit this linear regression on weekly sales with a simple lm() call in R.
\[ sales = baseline + b_1*trend + b_{2,3,4}*holidays +b_5*summer + b_6*marketing\]
The twist with MMM is that we don’t actually care about the fitted values (for now).3 Instead, we care more about getting accurate and reasonable coefficients (the \(b\) values). After fitting the MMM, we use the model coefficients to translate our marketing data into the incremental cheesecake sales that marketing drove.
The simple model above fits this data very well, so our coefficient on marketing spend is a good estimate for our marketing performance. This model suggest that for every $1 in marketing the Girls have invested, they see $1.90 in cheesecake sales. In MMM, this ratio of 1.9 is referred to as the SCR.
With these results we can say that sure, the Girls’ marketing seems to be worth it.
Bad news
This model is wrong and shouldn’t be used as-is to make business decisions. Marketing data is complicated; with this model we are simultaneously over- and underestimated marketing performance! We can do better and we will over the coming weeks.
The plan
Over the next few months, I’ll (try my hardest to) publish a series of weekly mini posts discussing different aspects of MMM and how they apply to the Girls’ question above: Is our marketing worth it?
I’ll cover data needs, transformations, model development, business assumptions, sales contribution calculations, scenario building, scenario optimization, and more. My main tool will be R and {tidymodels} but I’ll also be using these posts to teach myself how to build a full MMM in python, both using generic ML tools and MMM-specific libraries such as PyMC-Marketing and Google’s Meridian.
Follow me on BlueSky at @ryantimpe!
Footnotes
Measuring and defining the costs and benefits come with many challenges, so for now, they only focus on the easy-to-measure ones. We’ll ignore brand value, production costs, opportunity costs, etc.↩︎
Literally every word of that definition glosses over deep context that I’ll be covering over future posts.↩︎
Yes, yes, yes, I of course want a model that fits and performs well, but that’s not what I will be reporting when I deliver results to the business.↩︎