Diminishing Returns: how much is too much?

In addition to the carryover impact, which accounts for marketing stickiness, marketing data needs to also be transformed to account for its saturation when used in marketing mix models. In other words, how much marketing is too much? This is the concept of diminishing returns.
Diminishing returns
Imagine you see a commercial for a cheesecake. You’re unfamiliar with the brand and it makes you chuckle. You’re interested.
Over the next couple of days, you see it a few more times - you keep finding it amusing and you’re now familiar with the product. You tell yourself that next time you’re shopping, you’ll buy that cheesecake.
You don’t go to the store for a few days, but keep seeing the commercial. You slowly stop paying attention to it. You’ve already resolved to buy the cake. The commercial might be a gentle reminder for you, but not changing your decision. Each airing of the commercial costs the cheesecake business money, but at some point it stopped being effective for you (and likely hundreds of other people).
Another example:
The Girls decide to purchase a billboard marketing campaign to advertise their cheesecakes. They have three options:
- Rent a billboard on the outskirts of town for $100. Let’s say 100 people will see it.
- Rent a billboard in the busy downtown area for $200. We can assume 300 people will see it.
- Rent 2 billboards in the busy downtown area for $400. We estimate 450 people will see at least one of the billboards.
The goal of the billboard is to get as many unique people as possible to see their ad and learn about their cheesecakes. Option a is the cheapest, but in an area with low foot traffic. Option b is double the price but much more than double the people would see the ad. Option cwill further increase the chances of seeing the billboard, but would be seen by many of the same people as option b.
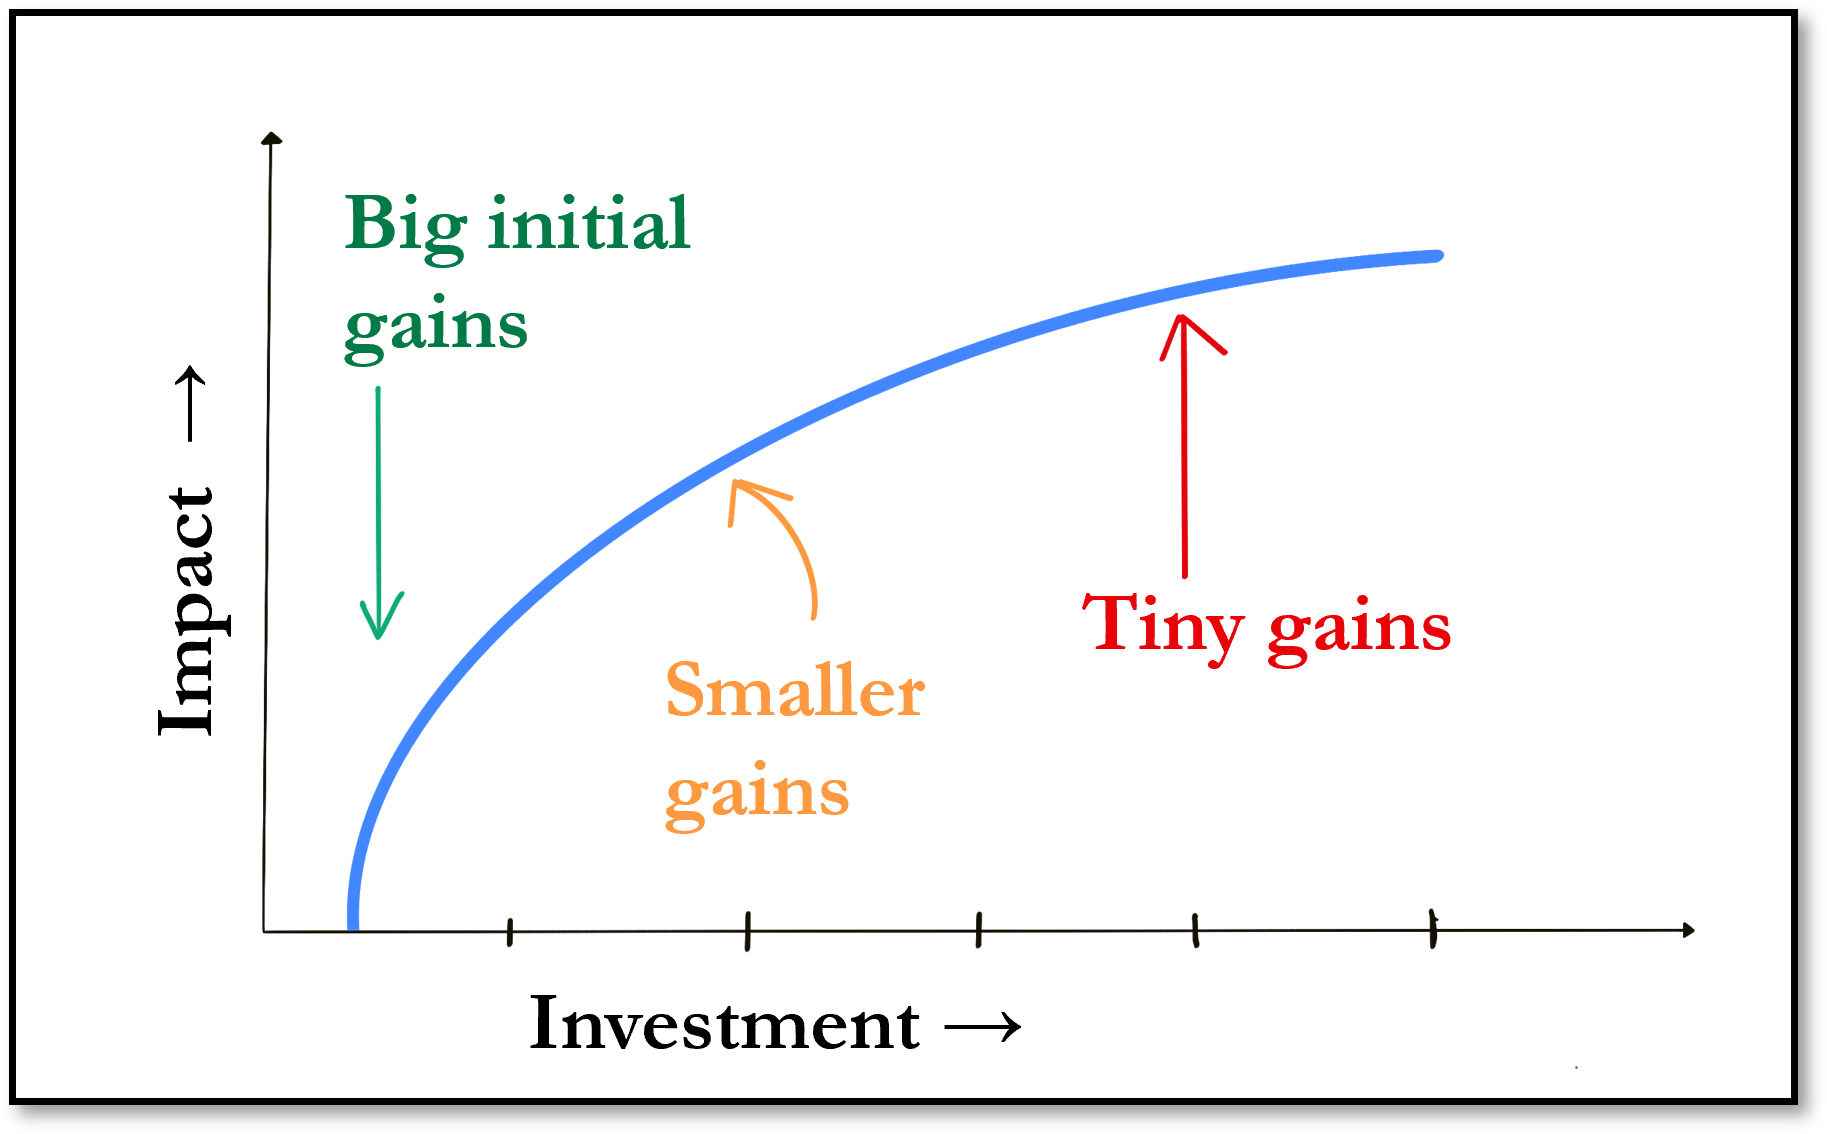
With option b, a doubling of investment more than doubles reach. With option c, a further doubling will not double reach.
Plotting this, we get this C-shaped curve and can estimate at which point the additional marketing stops being as effective.
Including diminishing returns in an MMM
In practice, we have a lot of potential equations to use to demonstrate and apply diminishing returns to marketing data.
1. Power Transformation (\(x^p\))
The Shape: A fixed concave curve (C-shape) where \(0.5ish < p < 1\).
Pros: High Efficiency. It requires only one parameter and is computationally “cheap” to tune.
Cons: Mandatory “waste.” It assumes the very first dollar spent is already subject to diminishing returns.
More cons: Lacks direct interpretability. A power of \(0.9\) is hard to translate into business context and strategy.
2. Negative Exponential (\(1 - e^{-\alpha x}\))
The Shape: A C-shaped curve that rises quickly and “levels off” at a plateau or saturation point.
Pros: Business intuition. The \(\alpha\) parameter directly represents the “speed of saturation.” Parameter constraints and interpretation make sense in marketing and investment terms.
Cons: Immediate efficacy. Like the power curve, it assumes marketing is highly effective at near-zero invesmtnet, which ignores “threshold” effects.
3. S-Shaped Curves (Hill / Logistic)
The Shape: Sigmoid (S-shape). It starts with a “ramp-up” phase (convex) before hitting diminishing returns (concave).
Pros: Real-world realism. It accounts for the “Threshold Effect”: the idea that you need a minimum “volume of noise” before the market even notices you.
Cons: Model Complexity. Requires at least two parameters (shape and scale). This increases the risk of overfitting and can make your optimization take significantly longer.
So….
Which one do you choose? It depends!
We trade mathematical simplicity for marketing realism: moving from a simple power curve to an S-curve lets us model the ‘threshold of attention’ at the cost of higher model complexity.
If you have confidence in your ability to accurately represent your marketing data with an S-curve, go for it. If you’re just trying to get started with a quick exploratory MMM, C-shaped curves are fine.
Next up!
Now that we have the basics covered, I’ll begin building a more complex marketing mix model for the Girls’ cheesecake business.
Follow me on BlueSky at @ryantimpe!