[1] 97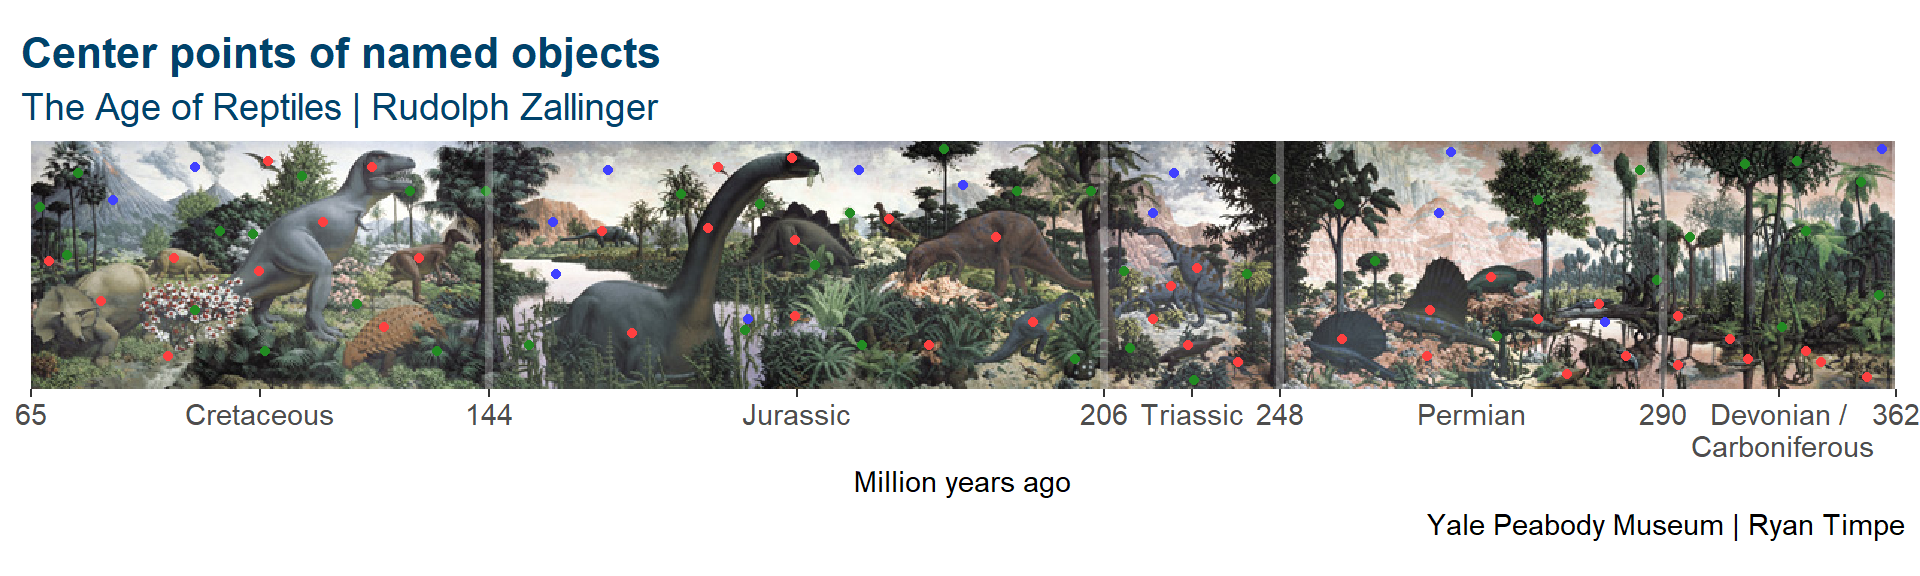
Originally published on January 03, 2018. Moved to new website on August 6, 2023 without edits.
Now that I have a few years more experience, it might be a good idea to revisit these ideas soon.
Work in Progress
In order to do more fun data analysis on the Age of Reptiles mural, I need to further divide the mural into its defining features - the plants and animals.
I began by manually finding the x-y coordinates of the center points of each of the named objects in the mural, as well as some key background features. Each animal was designated by one point, with the exception of the Tyrannosaur and large Brontosaurus (3 points each) and the cluster of fish on the far right (one point). For the plants, each cluster was counted once. For trees, the listed point is at the center of the leaves, ignoring the trunk.
| Object | Count |
|---|---|
| Animals | 37 |
| Plants | 40 |
| Background Objects | 15 |
[1] 97
In the image above, red points designate named animals, green designate named plant groups, and blue designate some background areas of significant size.
Next, using these points, I construct a Voronoi diagram. This divides the image into partitions for each named object, creating polygons containing every pixel that has the closest proximity to that point.
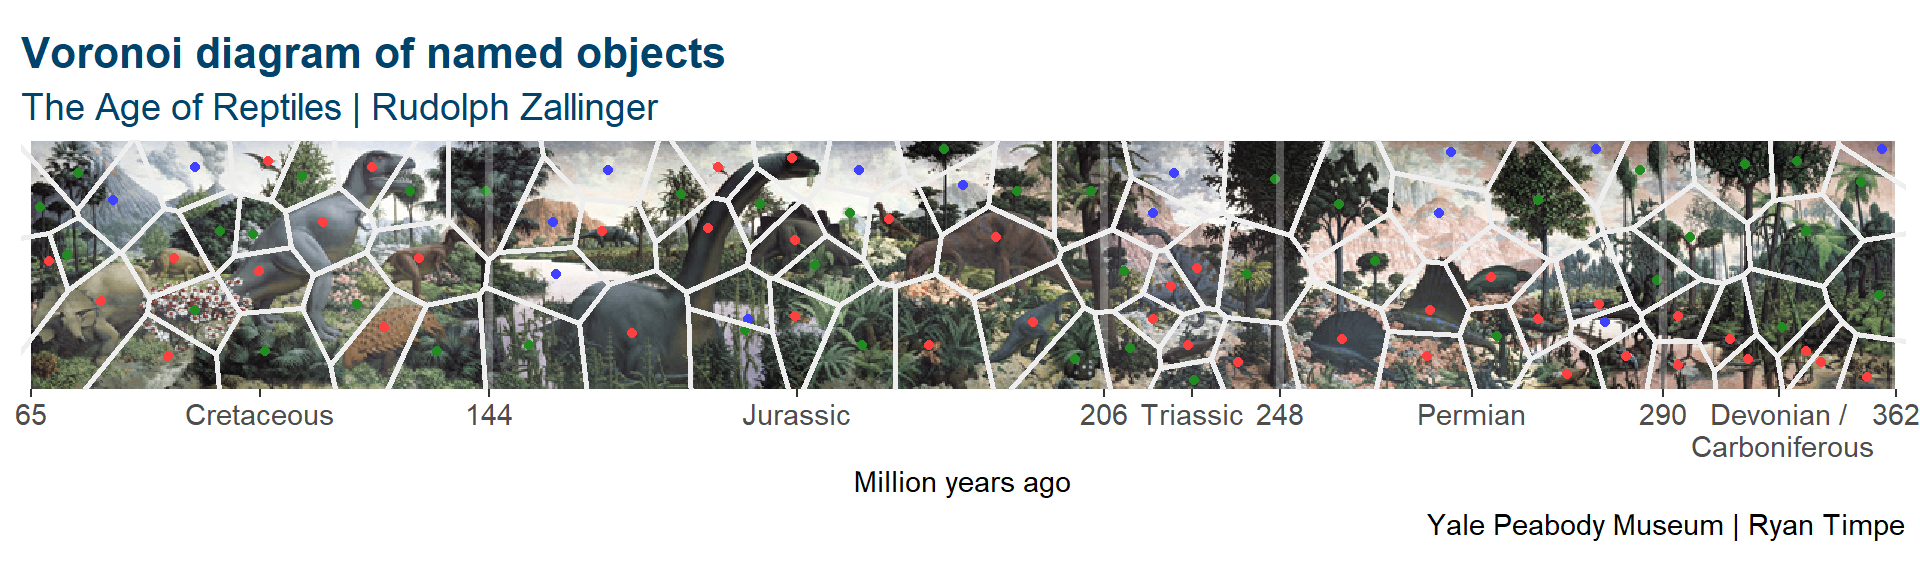
This rendering clarifies why it was necessary to provide three points for both the T.rex and Brontosaurus. With only a single point, most of the mass of the animals would be allocated to polygons centered around plants.
Going a step further, I filled in the polygons by their object designation.
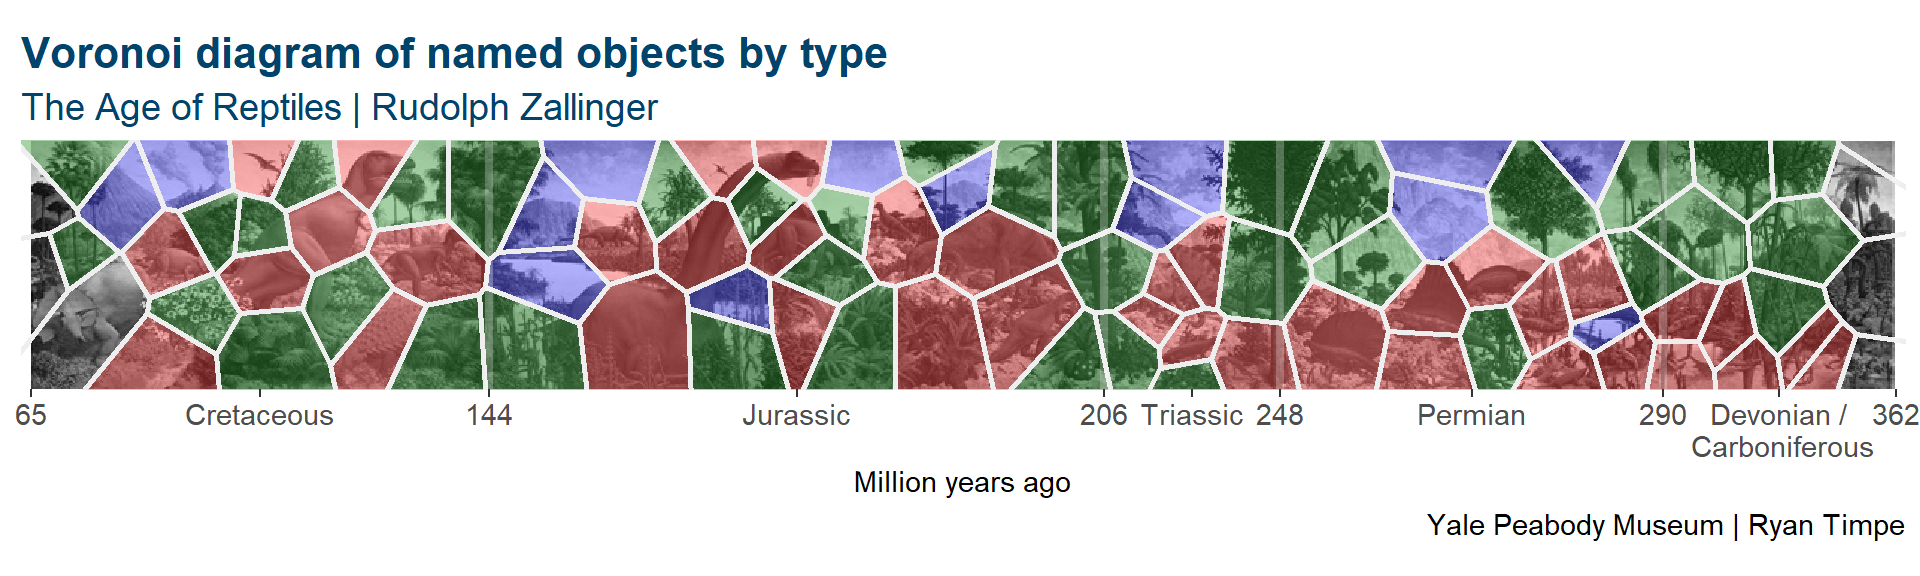
In later posts, I will use the Voronoi diagram for analyses on the plants and animals in the mural without having to manually draw the outlines of each object. (Maybe one day!)
For now, I can relate this back to the color post and fill each polygon with the average RGB channel the image around each center point.
